Are your models over-trained ? The weightwatcher tool can detect the signatures of overtraining in specific layers of a pre/trained Deep Neural Networks.
In the Figure above, fig (a) is well trained, whereas fig (b) may be over-trained. That orange spike on the far right is the tell-tale clue; it’s what we call a Correlation Trap.
Weightwatcher can detect the signatures of overtraining in specific layers of a pre/trained Deep Neural Networks. In this post, we show how to use the weightwatcher tool to do this.
WeightWatcher
WeightWatcher (WW): is an open-source, diagnostic tool for analyzing Deep Neural Networks (DNN), without needing access to training or even test data. It analyzes the weight matrices of a pre/trained DNN, layer-by-layer, to help you detect potential problems. Problems that can not be seen by just looking at the test accuracy or the training loss.
Installation:
pip install weightwatcher
Usage:
import weightwatcher as ww
import torchvision.models as models

model = models.vgg19_bn(pretrained=True)
watcher = ww.WeightWatcher(model=model)
details = watcher.analyze(plot=True, randomize=True)
For each layer, Weightwatcher plots the Empirical Spectral Density, or ESD. This is just a histogram of the eigenvalues of the layer correlation matrix X=WTW.
import numpy as np
import matplotlib,pyplot as plt
...
X = np.dot(W,W.T)
evals, evecs = np.linalg.eig(X(
plt.hist(evals, bin=100, density=True)
...
By specifying the randomize option, WW randomizes elements of the weight matrix W, and then computes the it’s ESD. This randomized ESD is overlaid on the orginal ESD of X, and ploted on a log scale.
This is shown above, in the RHS (right hand side). The original layer ESD is green; the randomized ESD is red, And the orange line depicts the largest eigenvalue 
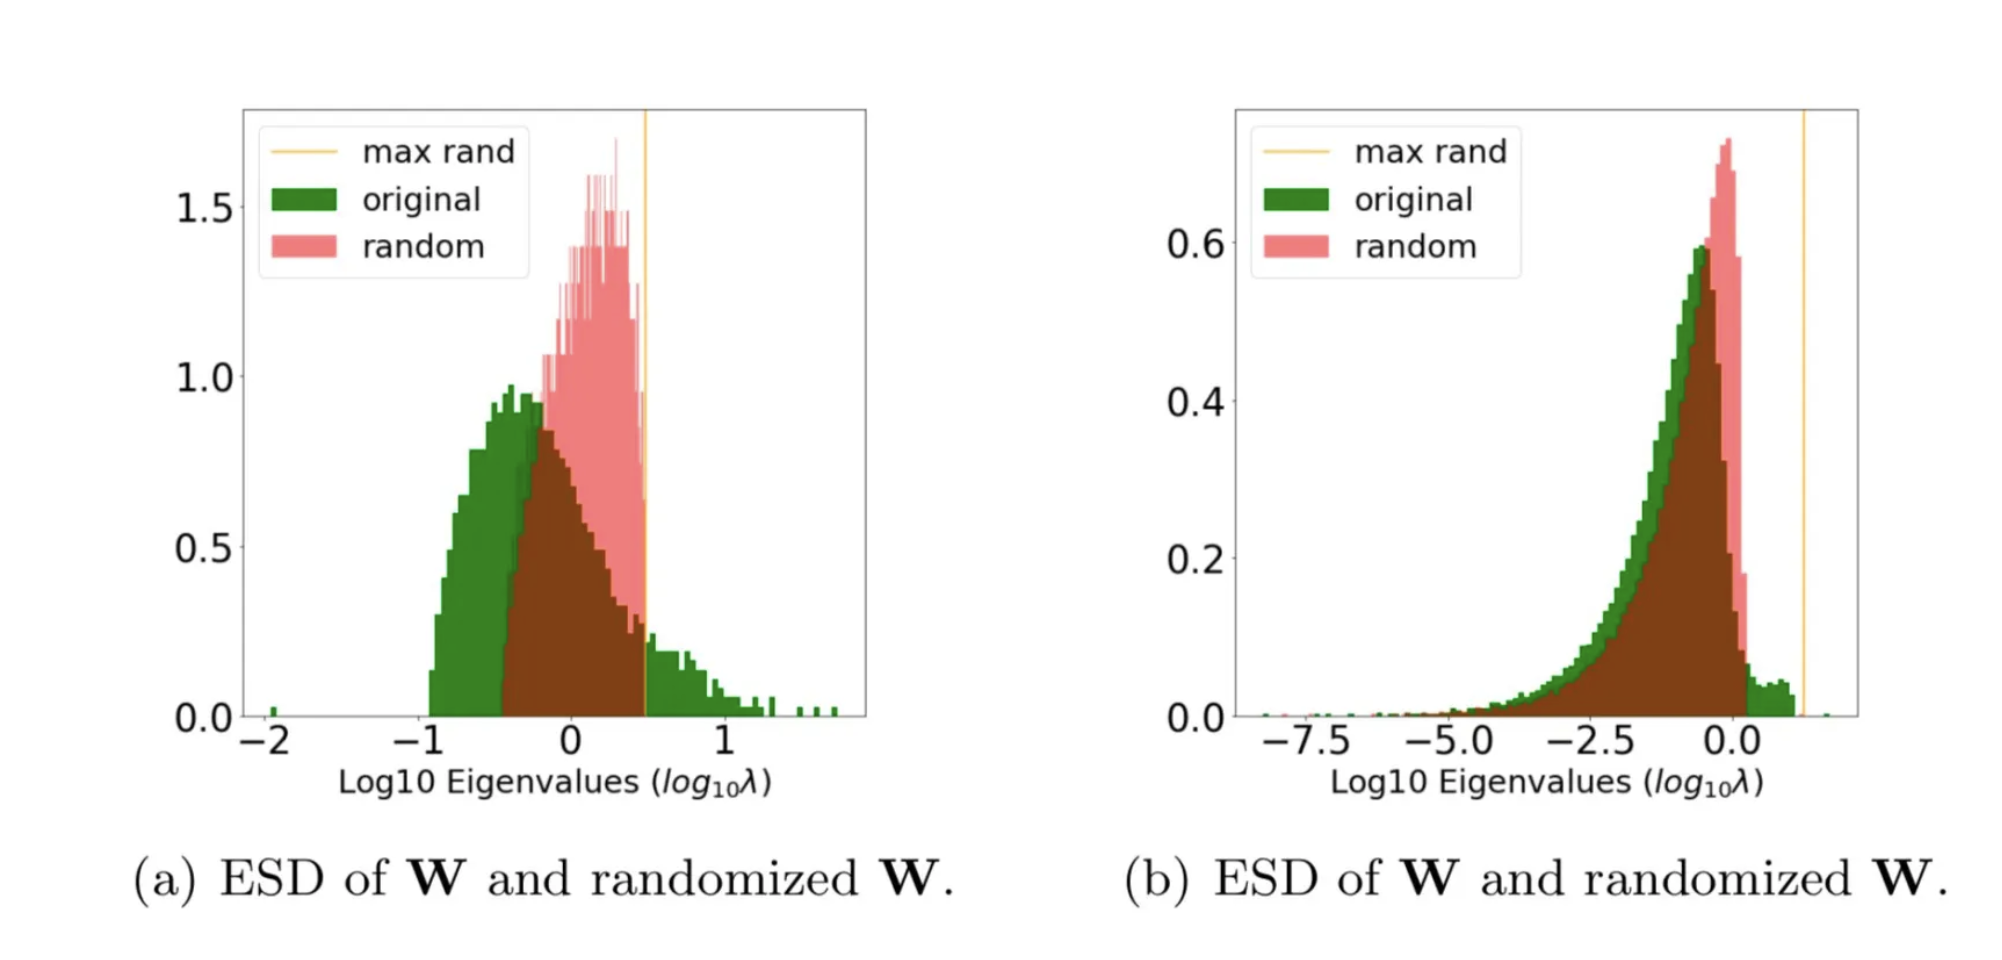
If the layer is well trained matrix, then when W is randomized, it’s ESD will look like that of a normally distributed random matrix. This is shown in Figure (a), above.
But if the layer is over-trained, then it’s weight matrix W may have some unusually large elements, where the correlations may concentrate, or become trapped. In this case, the ESD may have 1 or more unusually large eigenvalues. This is shown in Figure (b) above, with the orange line extending to the far right of the bulk of the red ESD.
Notice also that in Figure (a), the green ESD is very Heavy-Tailed, with the histogram extending out to log10=2, or the largest eigenvalue of nearly 100: 
In cases like this, we can identify the orange line as a Correlation Trap.
This indicates that something went wrong in training this layer, and the model did not capture the correlations in this layer in a way that will generalize well to other examples.
Conclusion
Using the Weight Watcher tool, you can detect this and other potential problems when training or fine-tuning your Deep Neural Networks.
You can learn more about it on the WeightWatcher github website.

5 Comments