WeightWatcher 0.7 has just been released, and it includes the new and improved advanced feature for analyzing Deep Neural Networks (DNN) called fix_fingers. To activate this, simply use:
details = watcher.analyze(..., fix_fingers='clip_xmax', ...)
This will take a tiny bit longer, and will yield more reliable alpha for your model layers, along with a new column, num_fingers, which reports the number of outliers found
Note that other metrics, such as alpha_weighted (alpha-hat), will not be affected.
It is recommended that the fix_fingers be added for all analysis moving forward, however, we have not completed a detailed study on the impact yet, so it has been included as an advanced feature.
So why do this ?
What was wrong; what’s been fixed ?
In our Nature paper (Nature Communications 2021), we looked at the layer alphas for the GPT2 models, and, among other things, noticed several large alphas, greater than 8 and even 10! These are outliers because no alpha should be greater than 8 (which is the minimum alpha for a random matrix).

Up until now, one just had to accept them as errant and/or remove them from our analysis. But now, I can explain where they come from and how to adjust the calculations when necessary.
Recall that the HTSR and SETOL theories describe the layer quality by analyzing the histogram of its eigenvalues–that is, we analyze the ESD (Empirical Spectral Density). The best-trained layers have a heavy-tailed ESD which can be well fit to a Power Law (PL)
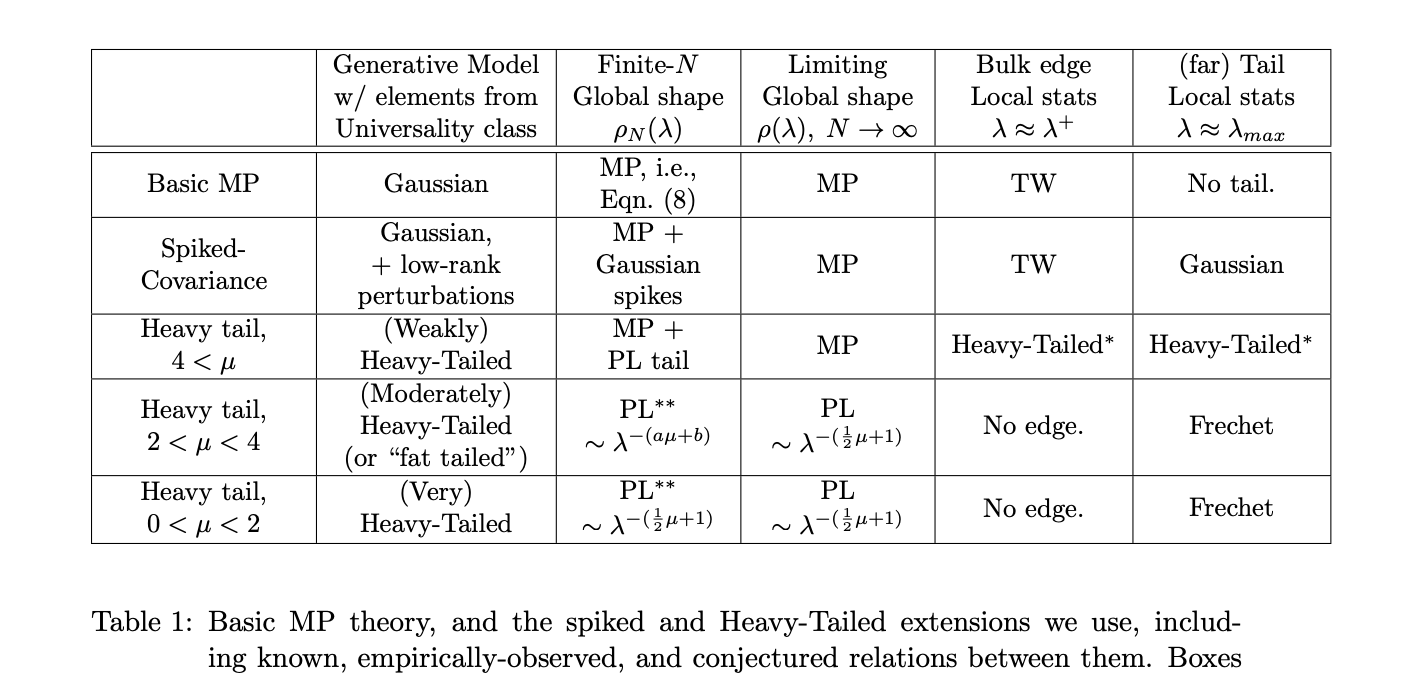
Fingers (i.e. outliers) tend to appear when the layer (Empirical Spectral Density) is really a Truncated Power Law (TPL), as opposed to a simple Power Law (PL). And that’s OK–it is actually predicted by the HTSR theory and for very large and/or high-quality layers. More precisely, we expect that, in the far tail, the (far) Tail Local stats will be Frechet.
So why not just fit a TPL ? Weightwatcher does support this (i.e. fit=’TPL’), but this is very slow, and, more importantly, we usually don’t have enough eigenvalues in the tail of the ESD to get a good TPL fit, and, instead, there are 1 or a few very large eigenvalues that degrade the PL fit.
We call these very large eigenvalues fingers because they look like fingers peeking out of the ESD tail.
How can we account for these outliers or fingers? Just remove them!
If we just remove. the TPL fingers when they appear, very frequently, and we are careful, we can recover a very good PL fit. (And this works better than using the fit=’TPL” option Let’s look at an example…
But before we do this, let’s discuss why they might appear.
The Critical Brain Hypothesis
The weightwatcher project is motivated by the theory of Self Organized Criticality (SOC), and the amazing fact that it has been successfully applied to understand the observed behavior of real-world (biological) spiking neurons. This is called the Critical Brain Hypothesis.

The weightwatcher theory posits that Deep Neural Networks (DNNs) exhibit the same signatures of criticality–namely power law behavior–as frequently seen in neuroscience experiments on real neurons.
Moreover, I believe that as LLMs (Large Language Models) approach true Self-Organized-Criticality, we will even more amazing properties emerge.
The weightwatcher theory posits that Deep Neural Networks (DNNs) exhibit the same signatures of criticality–namely power law behavior–as frequently seen in neuroscience experiments on real neurons.
New and Improved Metrics for GPT
Let’s see how the new and improved fix_fingers works on GPT and GPT2
FIrst, we need to download the models (from HuggingFace)
import transformers
from transformers import OpenAIGPTModel,GPT2Model

gpt_model = OpenAIGPTModel.from_pretrained('openai-gpt')
gpt_model.eval();

gpt2_model = GPT2Model.from_pretrained('gpt2')
gpt2_model.eval();
Now, let’s run weightwatcher
import weightwatcher as ww
watcher = ww.WeightWatcher()
gpt_details = watcher.analyze(model=gpt_model, fix_fingers='clip_xmax')
gpt2_details = watcher.analyze(model=gpt2_model, fix_fingers='clip_xmax')
Finally, we can generate a histogram of the layer alphas
gpt_details.alpha.plot.hist(bins=100, color='red', alpha=0.5, density=True, label='gpt')
gpt2_details.alpha.plot.hist(bins=100, color='green', density=True, label='gpt2')
plt.legend()
plt.xlabel(r"alpha $(\alpha)$ PL exponent")
plt.title(r"GPT vs GPT2 layer alphas $(\alpha)$ w/Fixed Fingers")
Here are the results

We see that the GPT model still has several fingers, (alphas >=6) , and, on average, larger alphas than GPT2. But there are fewer fingers than previously.
Summary: a new and improved Power Law estimator
We have introduced the new and improved option
details = watcher.analyze(..., fix_fingers='clip_xmax', ...)
which will provide more stable and smaller alphas for layers that are well-trained.
I encourage you to try it and see if it works better for you. And please let me know.
The weightwatcher tool has been developed by Calculation Consulting. We provide consulting to companies looking to implement Data Science, Machine Learning, and/or AI solutions. Reach out today to learn how to get started with your own AI project. Email: Info@CalculationConsulting.com

1 Comment